
Real time, cross platform visualizations with zero dependencies for the N-body package REBOUND
Article Sidebar
Main Article Content
Abstract
Background
Visualizations have become an indispensable part of the scientific process. A vibrant ecosystem of visualization tools exists, catering to a wide variety of different needs. Real-time visualizations of numerical simulations offer scientists immediate feedback about the status of their simulations and can also be valuable educational and public outreach tools.
Current Challenges
Developing a visualization tool with support for different operating systems, CPU/GPU architectures, and programming languages can be a challenge. It is common to use one or more graphics or UI libraries to act as abstraction layers and hide the underlying complexity. Whereas external libraries greatly simplify the initial programming effort, we argue that relying on them introduces new dependencies and problems, such as a higher entry barriers for new developers and users, and uncertainty regarding long-term support.
Proposed Solution
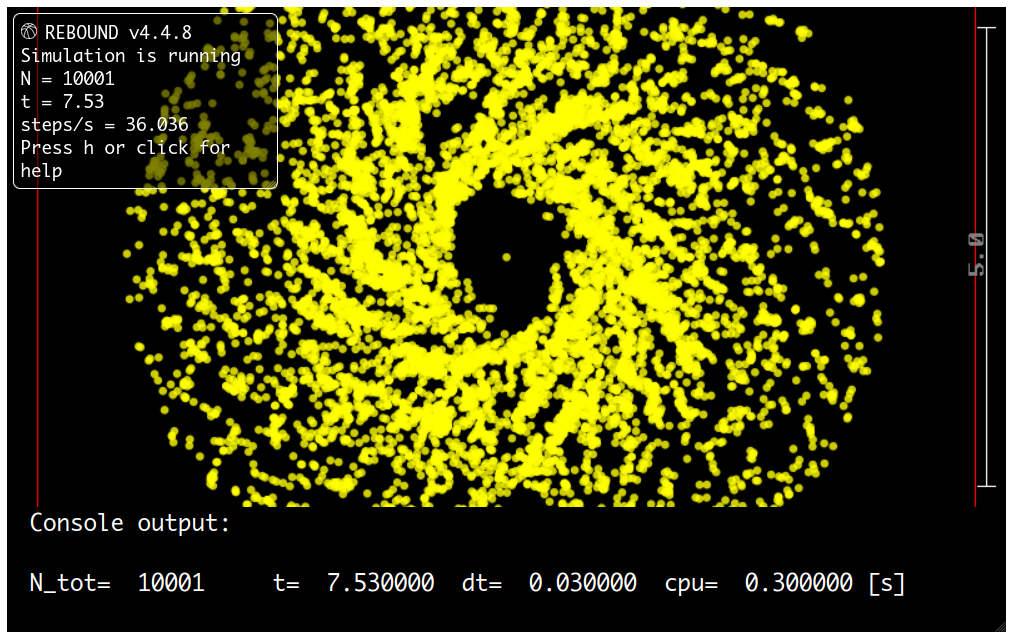
In this paper we present a new approach for real time visualizations which we have implemented for the N-body package REBOUND (Rein and Liu 2012). We propose to use a web browser to handle GPU accelerated rendering. This enables us to offer 3D, interactive visualizations on all major operating systems. What makes our new approach unique is that we achieve this without the need for any external libraries. We utilize WebAssembly and emscripten to reuse existing OpenGL visualization code. Using communication via HTTP and a custom built-in web server, we are able to provide both local and remote real time visualizations. In addition to the browser based real time visualization, our approach offers other additional operating modes, including simulations running entirely within the browser, visualizations within jupyter notebooks, and traditional standalone visualizations using OpenGL. We focus on the implementation in REBOUND but the concepts and ideas discussed can be applied to many other areas in need of scientific and non-scientific real time visualizations.
Article Details

This work is licensed under a Creative Commons Attribution 4.0 International License.
References
Droettboom, Michael, Roman Yurchak, Hood Chatham, Dexter Chua, Marc Abramowitz, casatir, Jason Stafford, et al. 2021. “Pyodide/Pyodide:” Zenodo. https://doi.org/10.5281/zenodo.5156931.
Hunter, J. D. 2007. “Matplotlib: A 2D Graphics Environment.” Computing in Science & Engineering 9 (3): 90–95. https://doi.org/10.1109/MCSE.2007.55. DOI: https://doi.org/10.1109/MCSE.2007.55
Kluyver, Thomas, Benjamin Ragan-Kelley, Fernando Pérez, Brian Granger, Matthias Bussonnier, Jonathan Frederic, Kyle Kelley, et al. 2016. “Jupyter Notebooks—a Publishing Format for Reproducible Computational Workflows.” Positioning and Power in Academic Publishing: Players, Agents and Agendas, 87. DOI: https://doi.org/10.3233/978-1-61499-649-1-87
Rein, H., and S. -F. Liu. 2012. “REBOUND: an open-source multi-purpose N-body code for collisional dynamics” 537 (January): A128. https://doi.org/10.1051/0004-6361/201118085. DOI: https://doi.org/10.1051/0004-6361/201118085
Rein, H., and D. Tamayo. 2017. “A New Paradigm for Reproducing and Analysing n-Body Simulations of Planetary Systems.” MNRAS 467 (January): 2377–83. https://doi.org/10.1093/mnras/stx232. DOI: https://doi.org/10.1093/mnras/stx232
Rein, H., D. Tamayo, S.-F. Liu, L. Winkler, P. Bartram, A. Silburt, G. Brown, et al. 2025. “Hannorein/Rebound: 4.4.10.” Zenodo. https://doi.org/10.5281/zenodo.15784767.
Turk, M. J., B. D. Smith, J. S. Oishi, S. Skory, S. W. Skillman, T. Abel, and M. L. Norman. 2011. “yt: A Multi-code Analysis Toolkit for Astrophysical Simulation Data.” The Astrophysical Journal Supplement Series 192 (January): 9. https://doi.org/10.1088/0067-0049/192/1/9. DOI: https://doi.org/10.1088/0067-0049/192/1/9
Williams, Thomas, and Colin Kelley. 2013. “Gnuplot 4.6: An Interactive Plotting Program.” http://gnuplot.sourceforge.net/.
Williams, Jonathan Carifio, Henrik Norman, and A. David Weigel. 2022. “A Novel JupyterLab User Experience for Interactive Data Visualization.” arXiv e-Prints, December, arXiv:2212.03907. https://doi.org/10.48550/arXiv.2212.03907.