
Navigating and Narrating Interactive Flowcharts
Article Sidebar
Main Article Content
Abstract
Introduction. While the nonlinear and interconnected nature of flowcharts makes them well-suited for representing and communicating complex narratives, flowcharts can appear impersonal, unapproachable, and disorienting, especially with a large number of elements. We propose an interaction technique for flowcharts that combines the narrative depth of linear storytelling with the autonomy of open-ended exploration.
Related Work. This research builds on existing research on interactivity in data visualizations, sonic approaches to representing data, and flowcharts as a usually static genre of node-link diagrams conveying the structure and dynamics of nonlinear systems.
Design. We introduce a flowchart interface that integrates audio narration, progressive disclosure, and animated transitions with interactive capabilities for navigating the content of the narration and flowchart. Readers of the interactive flowchart can choose between narrated or exploratory perspectives, switching between linear and nonlinear readings of the chart.
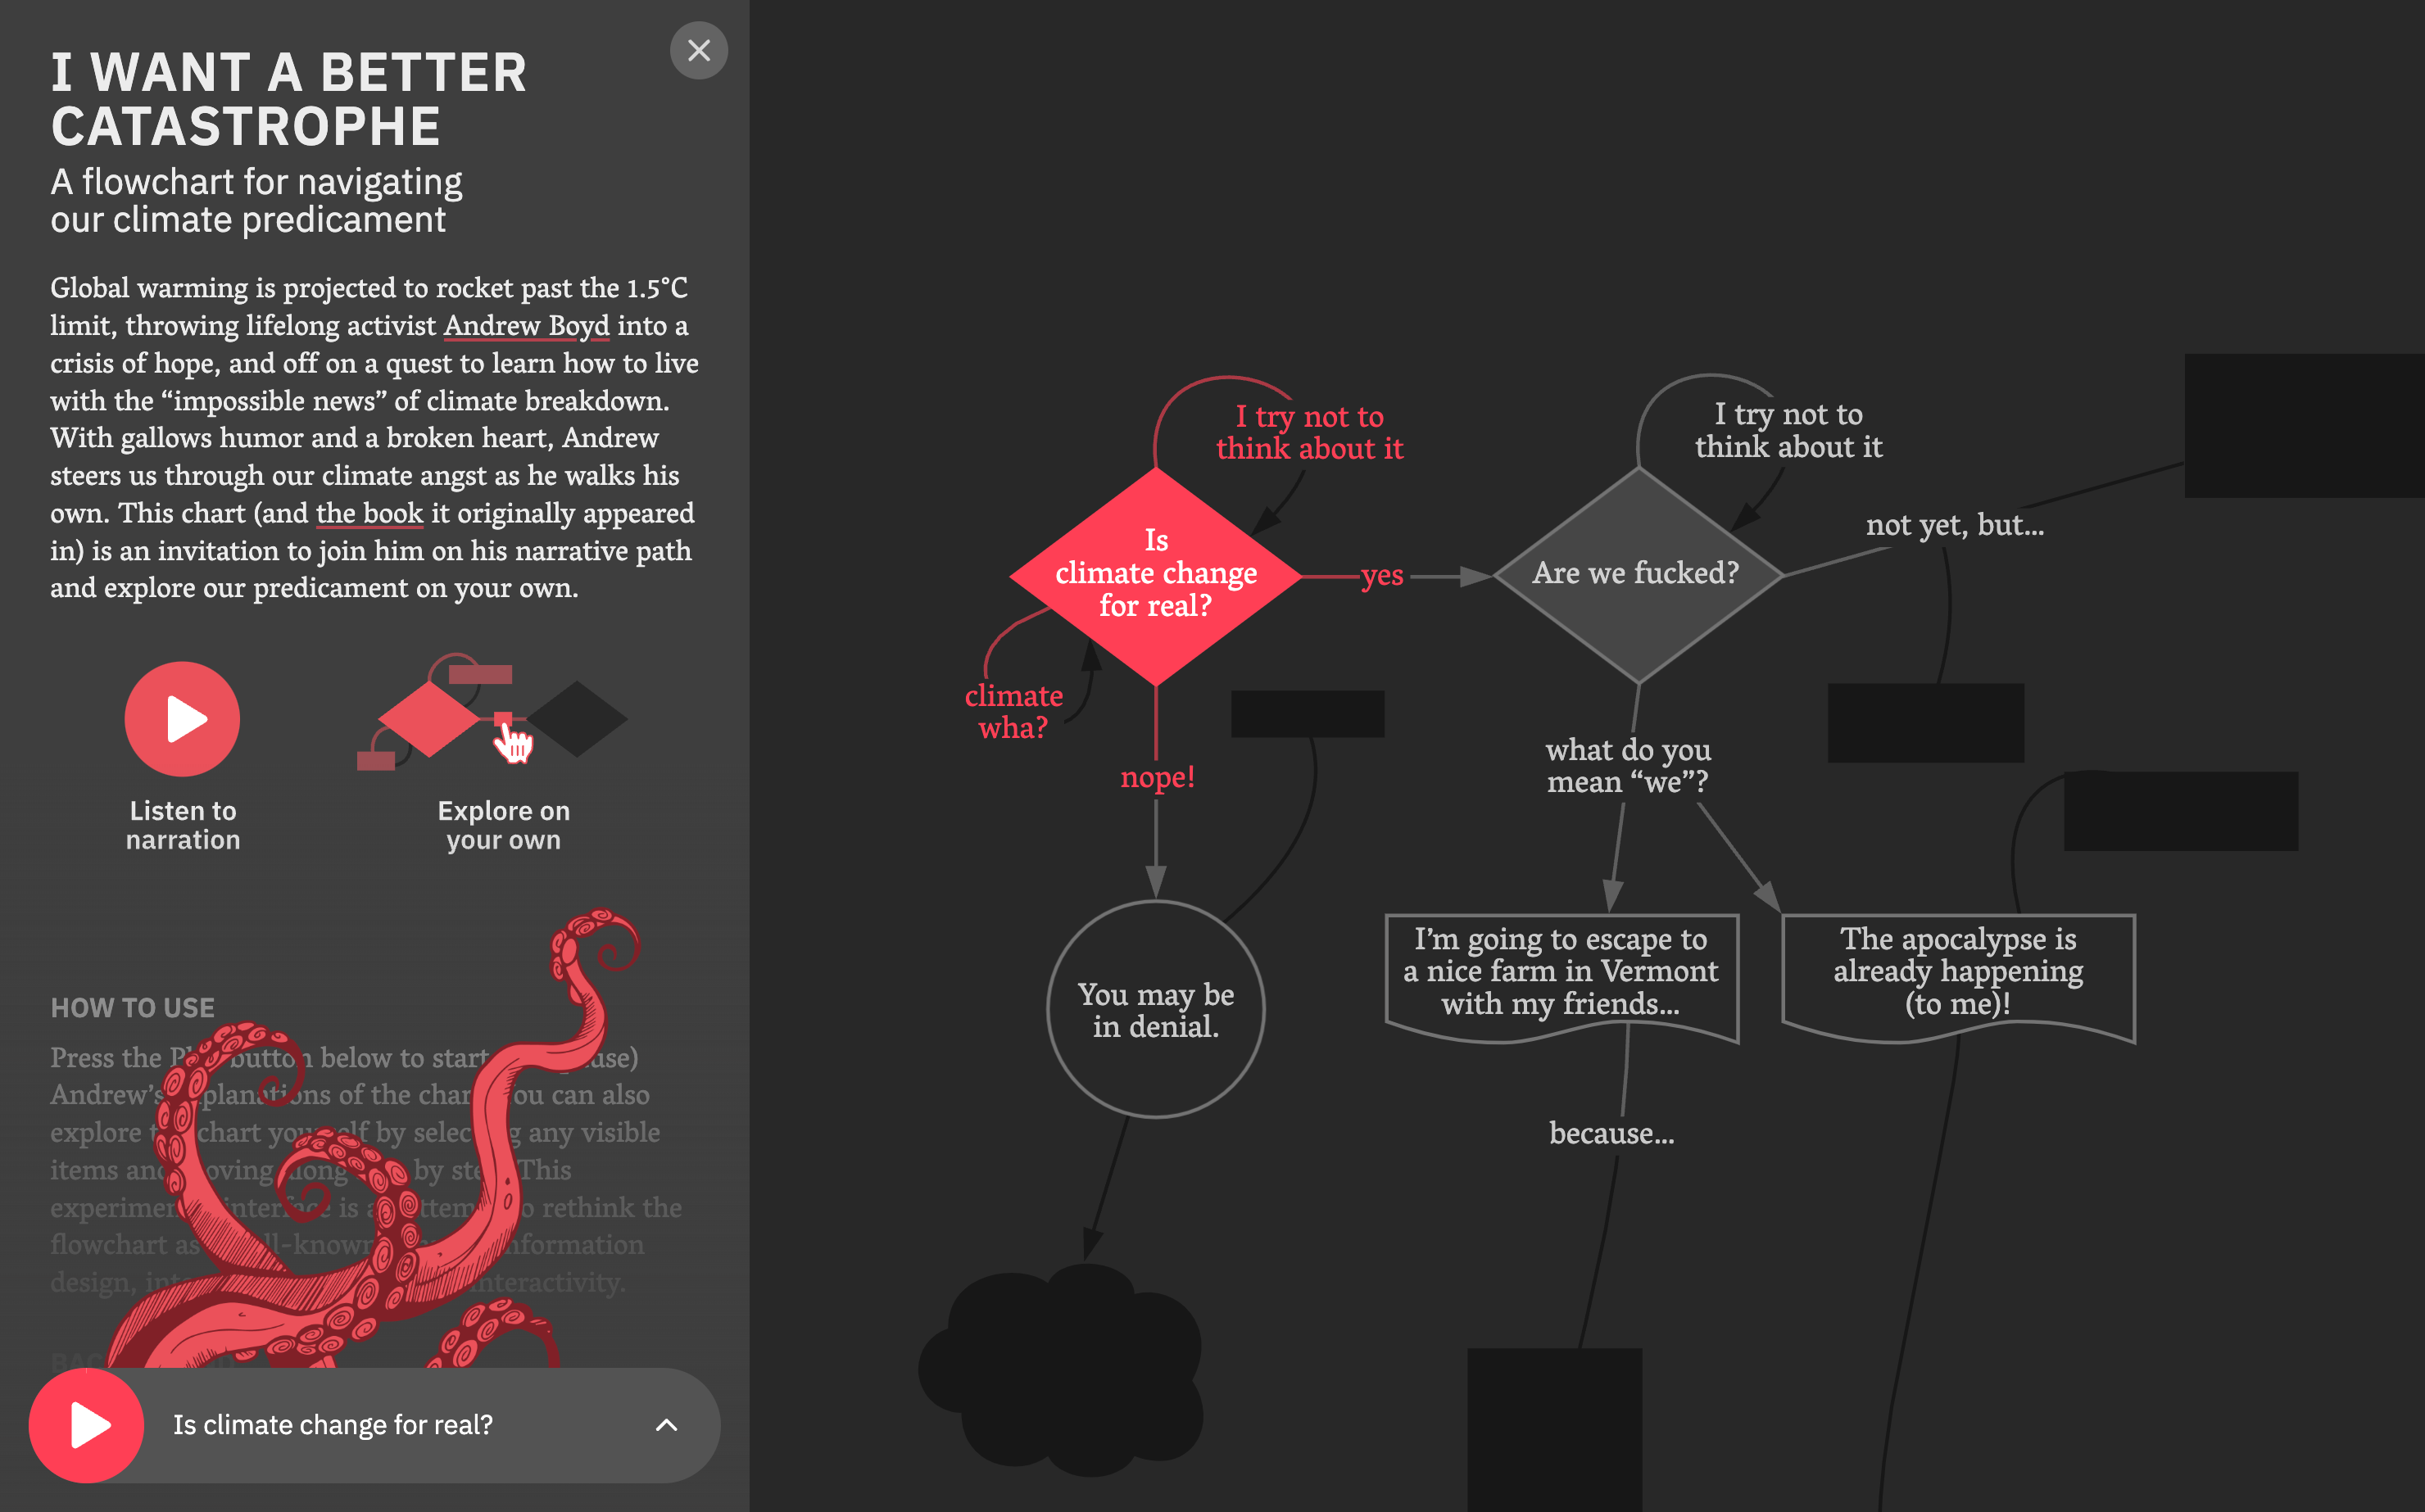
Demonstration. We illustrate the technique’s design principles using the case study “I Want a Better Catastrophe”, a flowchart taking viewers on a journey through the diverging paths of our climate predicament.
Evaluation. We study the potential of the technique by analyzing the reception of the case study through a feedback survey and anonymous activity logs, and by reflecting on the authoring of further interactive flowchart projects using an open-source template in the context of a university design course.
Conclusion. The results of the evaluation demonstrate the potential of an interactive flowchart that combines linear storytelling and open-ended exploration. Additionally, several directions for further development as well as new design opportunities emerge from the project. We believe the outlined technique underscores a more general potential for the harmonization and integration of narrative and exploratory approaches into data visualizations.
Materials. Links are available to the “I Want a Better Catastrophe” case study as well as the open-source interactive flowchart template. All materials, including those used for the purposes of the evaluation, are provided within this repository.
Article Details

This work is licensed under a Creative Commons Attribution-ShareAlike 4.0 International License.
References
[1] M. Allen. Flowcharting: From abstractionism to algorithmics in art and architecture. gta edition, 3, 2023. https://doi.org/10.54872/gta/4616 DOI: https://doi.org/10.54872/gta/4616
[2] E. Appelgren. An illusion of interactivity: The paternalistic side of data journalism. Journalism practice, 12(3):308–325, 2018. https://doi.org/10.1080/17512786.2017.1299032 DOI: https://doi.org/10.1080/17512786.2017.1299032
[3] B. Bach, M. Stefaner, J. Boy, S. Drucker, L. Bartram, J. Wood, P. Ciuccarelli, Y. Engelhardt, U. Koeppen, and B. Tversky. Narrative design patterns for data-driven storytelling. In Data-driven storytelling, pp. 107–133. AK Peters/CRC Press, 2018. https://doi.org/10.1201/9781315281575-5 DOI: https://doi.org/10.1201/9781315281575-5
[4] T. J. Berners-Lee. Information management: A proposal. Technical report, CERN, 1989. https://cds.cern.ch/record/369245/files/dd-89-001.pdf.
[5] J. Boy, F. Detienne, and J.-D. Fekete. Storytelling in information visualizations: Does it engage users to explore data? In CHI ’15: Proceedings of the SIGCHI Conference on Human Factors in Computing Systems, pp. 1449–1458. ACM, 2015. https://doi.org/10.1145/2702123.2702452 DOI: https://doi.org/10.1145/2702123.2702452
[6] A. Boyd. I Want a Better Catastrophe: Navigating the Climate Crisis with Grief, Hope, and Gallows Humor. New Society Publishers, 2023. https://newsociety.com/books/i/i-want-a-better-catastrophe.
[7] V. Brüggemann, M.-J. Bludau, and M. Dörk. The fold: Rethinking interactivity in data visualization. DHQ, 14(3), 2020. https://www.digitalhumanities.org/dhq/vol/14/3/000487/000487.html. DOI: https://doi.org/10.63744/5aycaj9wtv7j
[8] E. Bumiller. We have met the enemy and he is powerpoint. New York Times, 26:1–1, 2010. https://www.nytimes.com/2010/04/27/world/27powerpoint.html.
[9] N. Chapin. Flowcharts. ERIC, 1971. https://archive.org/details/flowcharts0000chap.
[10] E. Dimara and C. Perin. What is interaction for data visualization? IEEE transactions on visualization and computer graphics, 26(1):119–129, 2019. https://doi.org/10.1109/TVCG.2019.2934283 DOI: https://doi.org/10.1109/TVCG.2019.2934283
[11] M. Dörk, B. Müller, J.-E. Stange, J. Herseni, and K. Dittrich. Co-designing visualizations for information seeking and knowledge management. Open Information Science, 4:217–235, 2020. https://doi.org/10.1515/opis-2020-0102 DOI: https://doi.org/10.1515/opis-2020-0102
[12] T. Elli, U. Hinrichs, A. Bradley, Z. Hills, C. Collins, and K. Kelsky. Tied in knots: A case study on anthropographic data visualization about sexual harassment in the academy. In 2020 IEEE VIS Arts Program (VISAP), pp. 29–44. IEEE, 2020. https://doi.org/10.1109/VISAP51628.2020.00010 DOI: https://doi.org/10.1109/VISAP51628.2020.00010
[13] N. Elmqvist, A. V. Moere, H.-C. Jetter, D. Cernea, H. Reiterer, and T. Jankun-Kelly. Fluid interaction for information visualization. Information Visualization, 10(4):327–340, 2011. https://doi.org/10.1177/1473871611413180 DOI: https://doi.org/10.1177/1473871611413180
[14] N. Ensmenger. The multiple meanings of a flowchart. Information & Culture, 51(3):321–351, 2016. https://doi.org/10.7560/IC51302 DOI: https://doi.org/10.7560/IC51302
[15] M. Feng, E. Peck, and L. Harrison. Patterns and pace: Quantifying diverse exploration behavior with visualizations on the web. IEEE transactions on visualization and computer graphics, 25(1):501–511, 2018. https://doi.org/10.1109/tvcg.2018.2865117 DOI: https://doi.org/10.1109/TVCG.2018.2865117
[16] A. Figueiras. How to tell stories using visualization. In 2014 18th International conference on information visualisation, pp. 18–18. IEEE, 2014. https://doi.org/10.1109/IV.2014.78 DOI: https://doi.org/10.1109/IV.2014.78
[17] E. Geva. Faciliating reading comprehension through flowcharting. Reading Research Quarterly, 18(4):384, 1983. https://doi.org/10.2307/747375 DOI: https://doi.org/10.2307/747375
[18] F. B. Gilbreth and L. M. Gilbreth. Process charts: First steps in finding the one best way to do work. Journal of Fluids Engineering, 43:1029–1043, 1921. https://doi.org/10.1115/1.4058133 DOI: https://doi.org/10.1115/1.4058133
[19] F. Hohman, M. Conlen, J. Heer, and D. H. P. Chau. Communicating with interactive articles. Distill, 5(9):e28, 2020. https://doi.org/10.23915/distill.00028 DOI: https://doi.org/10.23915/distill.00028
[20] J. Hullman and N. Diakopoulos. Visualization rhetoric: Framing effects in narrative visualization. IEEE transactions on visualization and computer graphics, 17(12):2231–2240, 2011. https://doi.org/10.1109/TVCG.2011.255 DOI: https://doi.org/10.1109/TVCG.2011.255
[21] A. H. B. Jr. Cubism and Abstract Art: Painting, Sculpture, Constructions, Photography, Architecture, Industrial Art, Theatre, Films, Posters, Typography. Museum of Modern Art, 1936. https://archive.org/details/cubismabstractar0000muse.
[22] D. E. Knuth. Computer-drawn flowcharts. Communications of the ACM, 6(9):555–563, Sept. 1963. https://doi.org/10.1145/367593.367620 DOI: https://doi.org/10.1145/367593.367620
[23] G. Kramer, B. Walker, T. Bonebright, P. Cook, J. Flowers, N. Miner, and J. Neuhoff. Sonification report: Status of the field and research agenda. Faculty Publications, Department of Psychology, University of Nebraska, 444, 1997. https://digitalcommons.unl.edu/psychfacpub/444/.
[24] S. Lenzi and P. Ciuccarelli. Intentionality and design in the data sonification of social issues. Big Data & Society, 7(2):2053951720944603, 2020. https://doi.org/10.1177/2053951720944603 DOI: https://doi.org/10.1177/2053951720944603
[25] S. McKenna, N. Henry Riche, B. Lee, J. Boy, and M. Meyer. Visual narrative flow: Exploring factors shaping data visualization story reading experiences. Computer Graphics Forum, 36(3):377–387, 2017. https://doi.org/10.1111/cgf.13195 DOI: https://doi.org/10.1111/cgf.13195
[26] J. C. Nesbit and O. O. Adesope. Learning from animated concept maps with concurrent audio narration. The journal of experimental education, 79(2):209–230, 2011. https://doi.org/10.1080/00220970903292918 DOI: https://doi.org/10.1080/00220970903292918
[27] J. Nielsen. Progressive disclosure. Nielsen Norman Group, 2006. https://www.nngroup.com/articles/progressive-disclosure/.
[28] Z. Pousman, J. T. Stasko, and M. Mateas. Casual information visualization: Depictions of data in everyday life. IEEE Transactions on Visualization and Computer Graphics, 13(6):1145–1152, Nov/Dec 2007. https://doi.org/10.1109/tvcg.2007.70541 DOI: https://doi.org/10.1109/TVCG.2007.70541
[29] J. D. Rawlins and G. D. Wilson. Agency and interactive data displays: Internet graphics as co-created rhetorical spaces. Technical Communication Quarterly, 23(4):303–322, 2014. https://doi.org/10.1080/10572252.2014.942468 DOI: https://doi.org/10.1080/10572252.2014.942468
[30] A. Rind, M. Iber, and W. Aigner. Bridging the gap between sonification and visualization. In Proc. AVI Workshop on Multimodal Interaction for Data Visualization (MultimodalVis), 2018. https://multimodalvis.github.io/papers/AVI_2018_paper_155.pdf.
[31] J. C. Roberts, P. Butcher, A. Sherlock, and S. Nason. Explanatory journeys: Visualising to understand and explain administrative justice paths of redress. IEEE Transactions on Visualization and Computer Graphics, 28(1):518–528, 2021. https://doi.org/10.1109/tvcg.2021.3114818 DOI: https://doi.org/10.1109/TVCG.2021.3114818
[32] D. Scanlan. Structured flowcharts outperform pseudocode: an experimental comparison. IEEE Software, 6(5):28–36, Sept. 1989. https://doi.org/10.1109/52.35587 DOI: https://doi.org/10.1109/52.35587
[33] R. Schragis. Occupy wall street flowchart, 2011. https://www.rachelschragis.com/occupy.
[34] M. Sedlmair, M. Meyer, and T. Munzner. Design study methodology: Reflections from the trenches and the stacks. IEEE Transactions on Visualization and Computer Graphics, 18(12):2431–2440, 2012. https://doi.org/10.1109/TVCG.2012.213 DOI: https://doi.org/10.1109/TVCG.2012.213
[35] E. Segel and J. Heer. Narrative visualization: Telling stories with data. IEEE Transactions on Visualization and Computer Graphics, 16(6):1139–1148, Nov/Dec 2010. https://doi.org/10.1109/TVCG.2010.179 DOI: https://doi.org/10.1109/TVCG.2010.179
[36] A. Siu, G. SH Kim, S. O’Modhrain, and S. Follmer. Supporting accessible data visualization through audio data narratives. In Proceedings of the 2022 CHI Conference on Human Factors in Computing Systems, pp. 1–19, 2022. https://doi.org/10.1145/3491102.3517678 DOI: https://doi.org/10.1145/3491102.3517678
[37] A. Thudt, C. Perin, W. Willett, and S. Carpendale. Subjectivity in personal storytelling with visualization. Information Design Journal, 23(1):48–64, jul 2017. https://doi.org/10.1075/idj.23.1.07thu DOI: https://doi.org/10.1075/idj.23.1.07thu
[38] J. Walny, S. Huron, C. Perin, T. Wun, R. Pusch, and S. Carpendale. Active reading of visualizations. IEEE transactions on visualization and computer graphics, 24(1):770–780, 2017. https://doi.org/10.1109/TVCG.2017.2745958 DOI: https://doi.org/10.1109/TVCG.2017.2745958
[39] M. Whitelaw, S. Wassens, and A. Mackenzie. The sound of water: sensing a wetland intervention through interactive environmental audio. cultural geographies, p. 14744740231197813, 2023. https://doi.org/10.1177/14744740231197813 DOI: https://doi.org/10.1177/14744740231197813
[40] J. S. Yi, Y. ah Kang, J. Stasko, and J. A. Jacko. Toward a deeper understanding of the role of interaction in information visualization. IEEE transactions on visualization and computer graphics, 13(6):1224–1231, 2007. https://doi.org/10.1109/TVCG.2007.70515 DOI: https://doi.org/10.1109/TVCG.2007.70515