
Practice with uncertainty integration improves performance on a qualitatively different task and with new visualizations
Article Sidebar
Main Article Content
Abstract
Background: Every day, people must reason with uncertain information to make decisions that affect their lives and affect the performance of their jobs and organizations. Visualizations of data uncertainty can facilitate these decisions, but visualizations are often misunderstood or misused. Previous research has demonstrated that deliberate practice with uncertainty visualizations can improve decision-making in abstract conditions, but it is not yet known whether the learning gains from this practice will transfer to more concrete, realistic, and complex decision-making tasks.
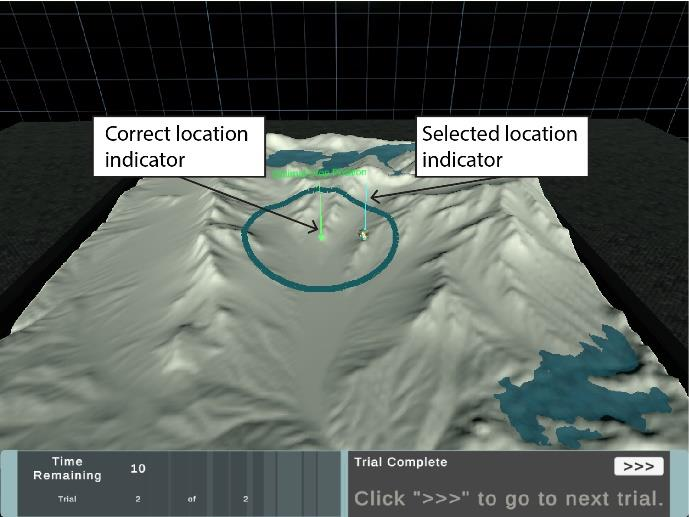
Objective: Here, we test the degree to which practice integrating multiple sources of uncertain information with abstract 2-d summary or ensemble displays improves performance on a similar transfer task involving decision-making with a 3-d virtual sand table.
Method: We conducted an online study with 378 participants who completed an uncertainty integration task in a 3-d virtual sand table context using either summary or ensemble displays of uncertainty. Participants had previously practiced with the same display, the other display, or received no opportunity to practice. We analyzed response accuracy and speed and how they changed throughout the task.
Results: Results suggest that deliberate practice with abstract uncertainty visualizations allows faster decision making in the new context but does not improve accuracy. In the 3-d task, the summary display generally yielded similar or better performance than the ensemble display. Learning gains from practice transferred to both same-type and different-type visualizations in the 3-d condition.
Conclusions: The results suggest that practice in the 2-d task enhanced facility with the underlying probabilistic reasoning in a new context rather than just increasing visualization-specific understanding. This implies that deliberate practice can be a beneficial tool to improve reasoning with uncertainty, including across contexts and across visualization types.
Materials: Stimuli, stimulus software, anonymized data, and analysis scripts and related code are available online at https://osf.io/5xdsg/?view_only=8d422629a3784f6a80cfeae40e59a078
Article Details

This work is licensed under a Creative Commons Attribution-NonCommercial-ShareAlike 4.0 International License.
References
Ashraf, A., Collins, D., Whelan, M., O’Sullivan, R., & Balfe, P. (2015). Three-dimensional (3d) simulation versus two-dimensional (2d) enhances surgical skills acquisition in standardised laparoscopic tasks: A before and after study. International Journal of Surgery, 14, 12– 16. https://doi.org/10.1016/j.ijsu.2014.12.020
Belia, S., Fidler, F., Williams, J., & Cumming, G. (2005). Researchers misunderstand confidence intervals and standard error bars. Psychological Methods, 10(4), 389. http://dx.doi.org/10.1037/1082-989X.10.4.389
Beattie, K. L., Hill, A., Horswill, M. S., Grove, P. M., & Stevenson, A. R. L. (2021). Laparoscopic skills training: The effects of viewing mode (2D vs. 3D) on skill acquisition and transfer. Surgical Endoscopy, 35(8), 4332–4344. https://doi.org/10.1007/s00464-020-07923-8
Boone, A. P., Maghen, B., & Hegarty, M. (2019). Instructions matter: Individual differences in navigation strategy and ability. Memory & Cognition, 47(7), 1401–1414. http://dx.doi.org/10.3758/s13421-019-00941-5
Cokely, E. T., Galesic, M., Schulz, E., Ghazal, S., & Garcia-Retamero, R. (2012). Measuring risk literacy: The berlin numeracy test. Judgment & Decision Making, 7(1), 25–47. https://doi.org/10.1017/s1930297500001819
Compeau, D. R., & Higgins, C. A. (1995). Computer self-efficacy: Development of a measure and initial test. MIS Quarterly, 19(2), 189–211. https://doi.org/10.2307/249688
Correll, M., & Gleicher, M. (2014). Error Bars Considered Harmful: Exploring Alternate Encodings for Mean and Error. IEEE Transactions on Visualization and Computer Graphics, 20(12), 2142–2151. https://doi.org/10.1109/TVCG.2014.2346298
Dhami, M. K., Mandel, D. R., Mellers, B. A., & Tetlock, P. E. (2015). Improving Intelligence Analysis With Decision Science. Perspectives on Psychological Science, 10(6), 753–757. https://doi.org/10.1177/1745691615598511
Ellis, G., & Dix, A. (2007). A taxonomy of clutter reduction for information visualisation. IEEE transactions on visualization and computer graphics, 13(6), 1216-1223.
Ericsson, K. A., Krampe, R. T., & Tesch-Römer, C. (1993). The role of deliberate practice in the acquisition of expert performance. Psychological Review, 100(3), 363. http://dx.doi.org/10.1037/0033-295X.100.3.363
Fernandes, M., Walls, L., Munson, S., Hullman, J., & Kay, M. (2018). Uncertainty Displays Using Quantile Dotplots or CDFs Improve Transit Decision-Making. Proceedings of the 2018 CHI Conference on Human Factors in Computing Systems, 1–12. https://doi.org/10.1145/3173574.3173718
Fiore, S. M., Song, J., Newton, O. B., Pittman, C., Warta, S. F., & LaViola, J. J. (2019). Determining the Effect of Training on Uncertainty Visualization Evaluations. In T. Z. Ahram & C. Falcão (Eds.), Advances in Usability, User Experience and Assistive Technology (Vol. 794, pp. 141–152). Springer International Publishing. https://doi.org/10.1007/978-3-319-94947-5_14
Frederick, S. (2005). Cognitive reflection and decision making. Journal of Economic Perspectives, 19(4), 25–42. https://doi.org/10.1257/089533005775196732
Galesic, M., & Garcia-Retamero, R. (2011). Graph literacy: A cross-cultural comparison. Medical Decision Making, 31(3), 444–457. https://doi.org/10.1177/0272989X10373805
Gigerenzer, G. (1996). The psychology of good judgment: Frequency formats and simple algorithms. Medical Decision Making, 16(3), 273–280. http://dx.doi.org/10.1177/0272989X9601600312
Greis, M., Joshi, A., Singer, K., Schmidt, A., & Machulla, T. (2018). Uncertainty Visualization Influences How Humans Aggregate Discrepant Information. Proceedings of the 2018 CHI Conference on Human Factors in Computing Systems, 505:1-505:12. https://doi.org/10.1145/3173574.3174079
Grounds, M. A., & Joslyn, S. L. (2018). Communicating weather forecast uncertainty: Do individual differences matter? Journal of Experimental Psychology: Applied, 24, 18–33. https://doi.org/10.1037/xap0000165
Han, P. K. J., Babrow, A., Hillen, M. A., Gulbrandsen, P., Smets, E. M., & Ofstad, E. H. (2019). Uncertainty in health care: Towards a more systematic program of research. Patient Education and Counseling, 102(10), 1756–1766. https://doi.org/10.1016/j.pec.2019.06.012
Hegarty, M., Friedman, A., Boone, A. P., & Barrett, T. J. (2016). Where are you? The effect of uncertainty and its visual representation on location judgments in GPS-like displays. Journal of Experimental Psychology: Applied, 22(4), 381. http://dx.doi.org/10.1037/xap0000103
Hegarty, M., Smallman, H. S., Stull, A. T., & Canham, M. S. (2009). Naïve cartography: How intuitions about display configuration can hurt performance. Cartographica: The International Journal for Geographic Information and Geovisualization, 44(3), 171–186. https://doi.org/10.3138/carto.44.3.171
Hertwig, R., & Grüne-Yanoff, T. (2017). Nudging and boosting: Steering or empowering good decisions. Perspectives on Psychological Science, 12(6), 973–986. http://dx.doi.org/10.1177/1745691617702496
Higgins, E. T., Friedman, R. S., Harlow, R. E., Idson, L. C., Ayduk, O. N., & Taylor, A. (2001). Achievement orientations from subjective histories of success: Promotion pride versus prevention pride. European Journal of Social Psychology, 31(1), 3–23.
Hoffman, M. D., & Gelman, A. (2014). The No-U-turn sampler: Adaptively setting path lengths in Hamiltonian Monte Carlo. The Journal of Machine Learning Research, 15(1), 1593–1623. http://jmlr.org/papers/v15/hoffman14a.html
Hullman, J. (2020). Why Authors Don’t Visualize Uncertainty. IEEE Transactions on Visualization and Computer Graphics, 26(1), 130–139. https://doi.org/10.1109/TVCG.2019.2934287
Hullman, J., Resnick, P., & Adar, E. (2015). Hypothetical Outcome Plots Outperform Error Bars and Violin Plots for Inferences about Reliability of Variable Ordering. PLOS ONE, 10(11), e0142444. https://doi.org/10.1371/journal.pone.0142444
John, O. P., & Srivastava, S. (1999). The Big Five Trait taxonomy: History, measurement, and theoretical perspectives. In L. A. Pervin & O. P. John (Eds.), Handbook of personality: Theory and research (2nd ed., pp. 102–138). Guilford Press.
Joslyn, S. L., & LeClerc, J. E. (2012). Uncertainty forecasts improve weather-related decisions and attenuate the effects of forecast error. Journal of Experimental Psychology: Applied, 18(1), 126. http://dx.doi.org/10.1037/a0025185
Kay, M., Kola, T., Hullman, J. R., & Munson, S. A. (2016). When (ish) is my bus? User-centered visualizations of uncertainty in everyday, mobile predictive systems. Proceedings of the 2016 Chi Conference on Human Factors in Computing Systems, 5092–5103. http://dx.doi.org/10.1145/2858036.2858558
Kusumastuti, S. A., Pollard, K. A., Oiknine, A. H., Dalangin, B., Raber, T. R., & Files, B. T. (2022). Practice improves performance of a 2D uncertainty integration task within and across visualizations. IEEE Transactions on Visualization and Computer Graphics. http://dx.doi.org/10.1109/TVCG.2022.3173889
Lejarraga, T., & Hertwig, R. (2021). How experimental methods shaped views on human competence and rationality. Psychological Bulletin, 147(6), 535. http://dx.doi.org/10.1037/bul0000324
Liao, H., Dong, W., Peng, C., & Liu, H. (2017). Exploring differences of visual attention in pedestrian navigation when using 2D maps and 3D geo-browsers. Cartography and Geographic Information Science, 44(6), 474–490. https://doi.org/10.1080/15230406.2016.117488
Metcalfe, J. S., Gordon, S. M., Passaro, A. D., Kellihan, B., & Oie, K. S. (2015). Towards a translational method for studying the influence of motivational and affective variables on performance during human-computer interactions. International Conference on Augmented Cognition, 63–72.
Nguyen, F., Qiao, X., Heer, J., & Hullman, J. (2020). Exploring the effects of aggregation choices on untrained visualization users’ generalizations from data. Computer Graphics Forum, 39(6), 33–48. http://dx.doi.org/10.1111/cgf.13902
Padilla, L. M., Castro, S. C., & Hosseinpour, H. (2021). A review of uncertainty visualization errors: Working memory as an explanatory theory. Psychology of Learning and Motivation, 74, 275–315. http://dx.doi.org/10.1016/bs.plm.2021.03.001
Padilla, L. M., Creem-Regehr, S. H., Hegarty, M., & Stefanucci, J. K. (2018). Decision making with visualizations: A cognitive framework across disciplines. Cognitive Research: Principles and Implications, 3(1), 29. https://doi.org/10.1186/s41235-018-0120-9
Padilla, L. M., Dryhurst, S., Hosseinpour, H., & Kruczkiewicz, A. (2021). Multiple Hazard Uncertainty Visualization Challenges and Paths Forward. Frontiers in Psychology, 12. https://www.frontiersin.org/articles/10.3389/fpsyg.2021.579207
Padilla, L. M., Kay, M., & Hullman, J. (2020). Uncertainty Visualization. In Handbook of Computational Statistics and Data Science. PsyArXiv. https://doi.org/10.31234/osf.io/ebd6r
Padilla, L. M., Powell, M., Kay, M., & Hullman, J. (2021). Uncertain About Uncertainty: How Qualitative Expressions of Forecaster Confidence Impact Decision-Making With Uncertainty Visualizations. Frontiers in Psychology, 11. https://doi.org/10.3389/fpsyg.2020.579267
Padilla, L. M., Ruginski, I. T., & Creem-Regehr, S. H. (2017). Effects of ensemble and summary displays on interpretations of geospatial uncertainty data. Cognitive Research: Principles and Implications, 2(1), 40. https://doi.org/10.1186/s41235-017-0076-1
Pollard K., Siriwardena P.M., Krum D.M., Files B.T. (2022). Volumetric hazard visualization and navigation in simulated augmented reality. Technical report ARL-TR-9572. DEVCOM Army Research Laboratory
Ruginski, I. T., Boone, A. P., Padilla, L. M., Liu, L., Heydari, N., Kramer, H. S., Hegarty, M., Thompson, W. B., House, D. H., & Creem-Regehr, S. H. (2016). Non-expert interpretations of hurricane forecast uncertainty visualizations. Spatial Cognition & Computation, 16(2), 154–172. https://doi.org/10.1080/13875868.2015.1137577
Ryan, R. M. (1982). Control and information in the intrapersonal sphere: An extension of cognitive evaluation theory. Journal of Personality and Social Psychology, 43(3), 450–461. https://doi.org/10.1037/0022-3514.43.3.450
Smallman, H. S., & Cook, M. B. (2011). Naïve realism: Folk fallacies in the design and use of visual displays. Topics in Cognitive Science, 3(3), 579–608. https://doi.org/10.1111/j.1756-8765.2010.01114.x
Song, J., Newton, O. B., Fiore, S. M., Pittman, C., & LaViola, J. J. (2019). Examining Training Comprehension and External Cognition in Evaluations of Uncertainty Visualizations to Support Decision Making. Proceedings of the Human Factors and Ergonomics Society Annual Meeting, 63(1), 1654–1658. https://doi.org/10.1177/1071181319631520
Stan Development Team. (2022). Stan Modeling Language Users Guide and Reference Manual (2.29.2) [Computer software]. http://mc-stan.org
Tak, S., Toet, A., & van Erp, J. (2014). The Perception of Visual Uncertainty Representation by Non-Experts. IEEE Transactions on Visualization and Computer Graphics, 20(6), 935–943. https://doi.org/10.1109/TVCG.2013.247
Tak, S., Toet, A., & van Erp, J. (2015). Public Understanding of Visual Representations of Uncertainty in Temperature Forecasts. Journal of Cognitive Engineering and Decision Making, 9(3), 241–262. https://doi.org/10.1177/1555343415591275