Main Navigation
Main Content
Sidebar
Register
Login
Toggle navigation
Current
Archives
About
About the Journal
Submissions
Privacy Statement
Contact
Search
Home
Info+
Info+
6 Items
Greetings From. . . A Workshop to Visualise Unexpected Stories of a Place Through Data Postcards
Sofia Cretaio, Chiara L. Remondino
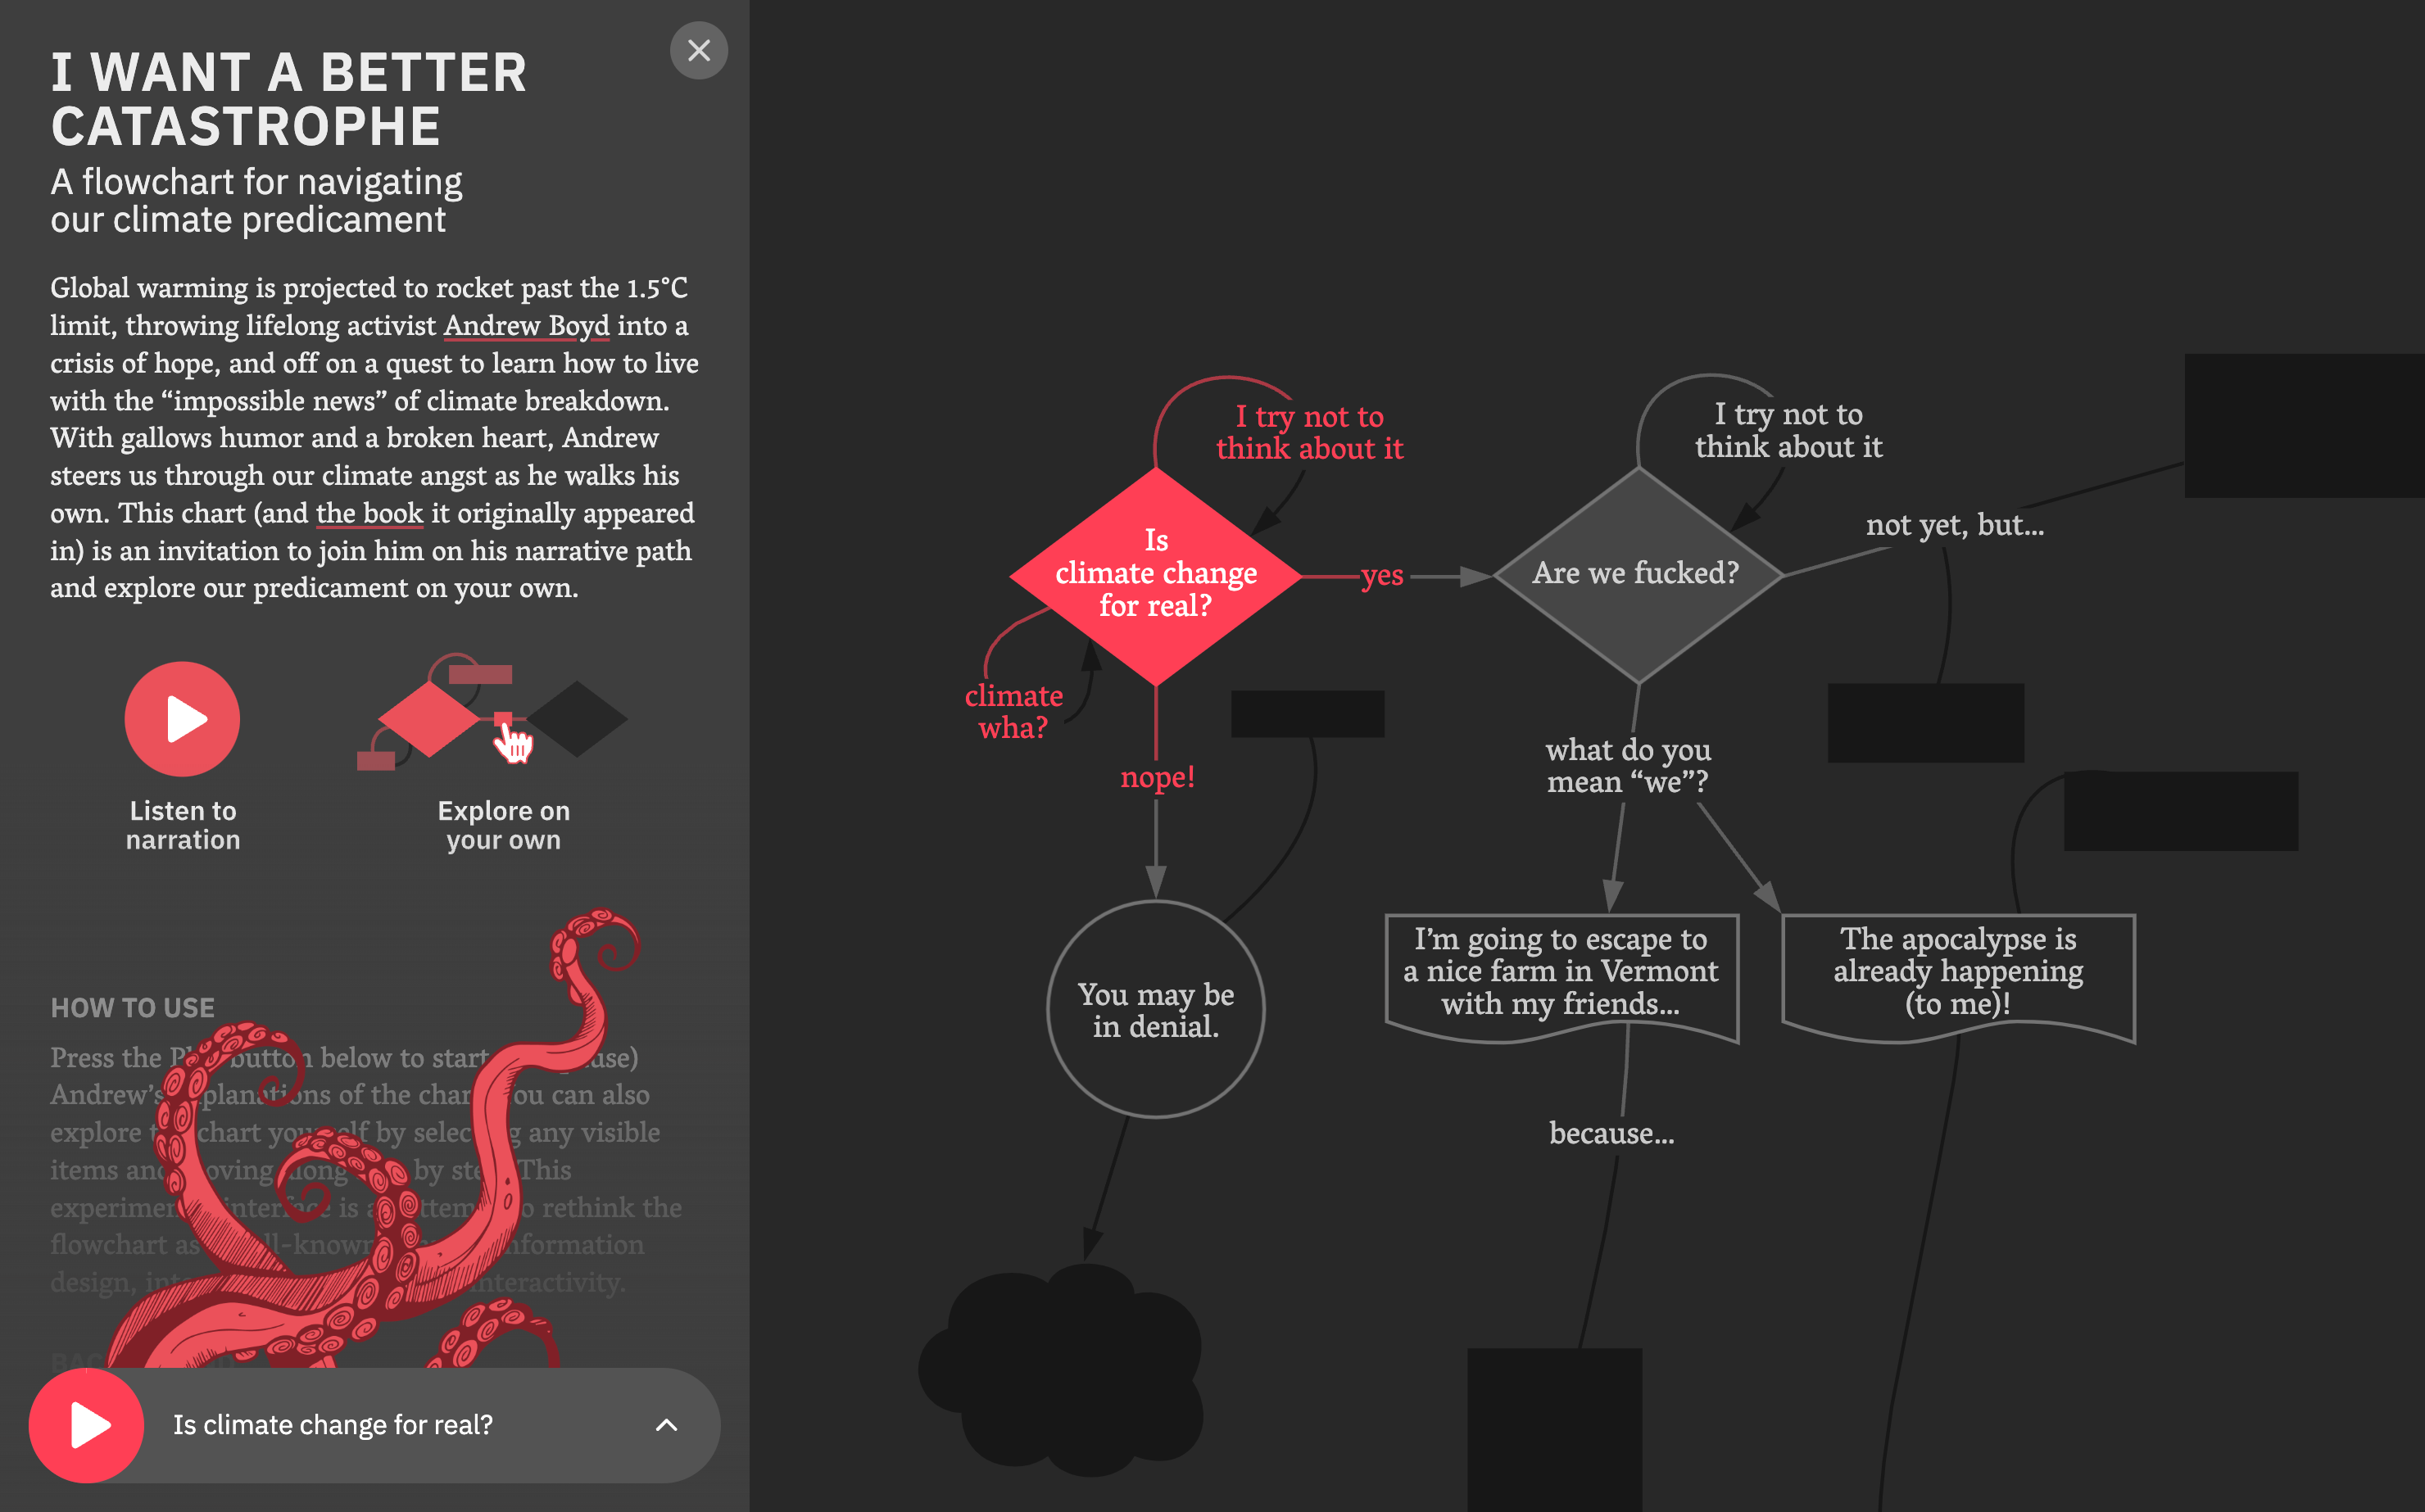
Navigating and Narrating Interactive Flowcharts
Jona Pomerance, Andrew Boyd, Marian Dörk
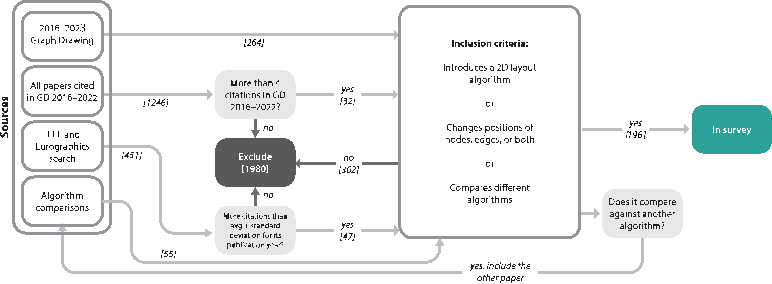
GLaDOS: Graph Layout algorithm Datasets for Open Science
Sara Di Bartolomeo, Connor Wilson, Eduardo Puerta, Tarik Crnovrsanin, Alexander Frings, Cody Dunne
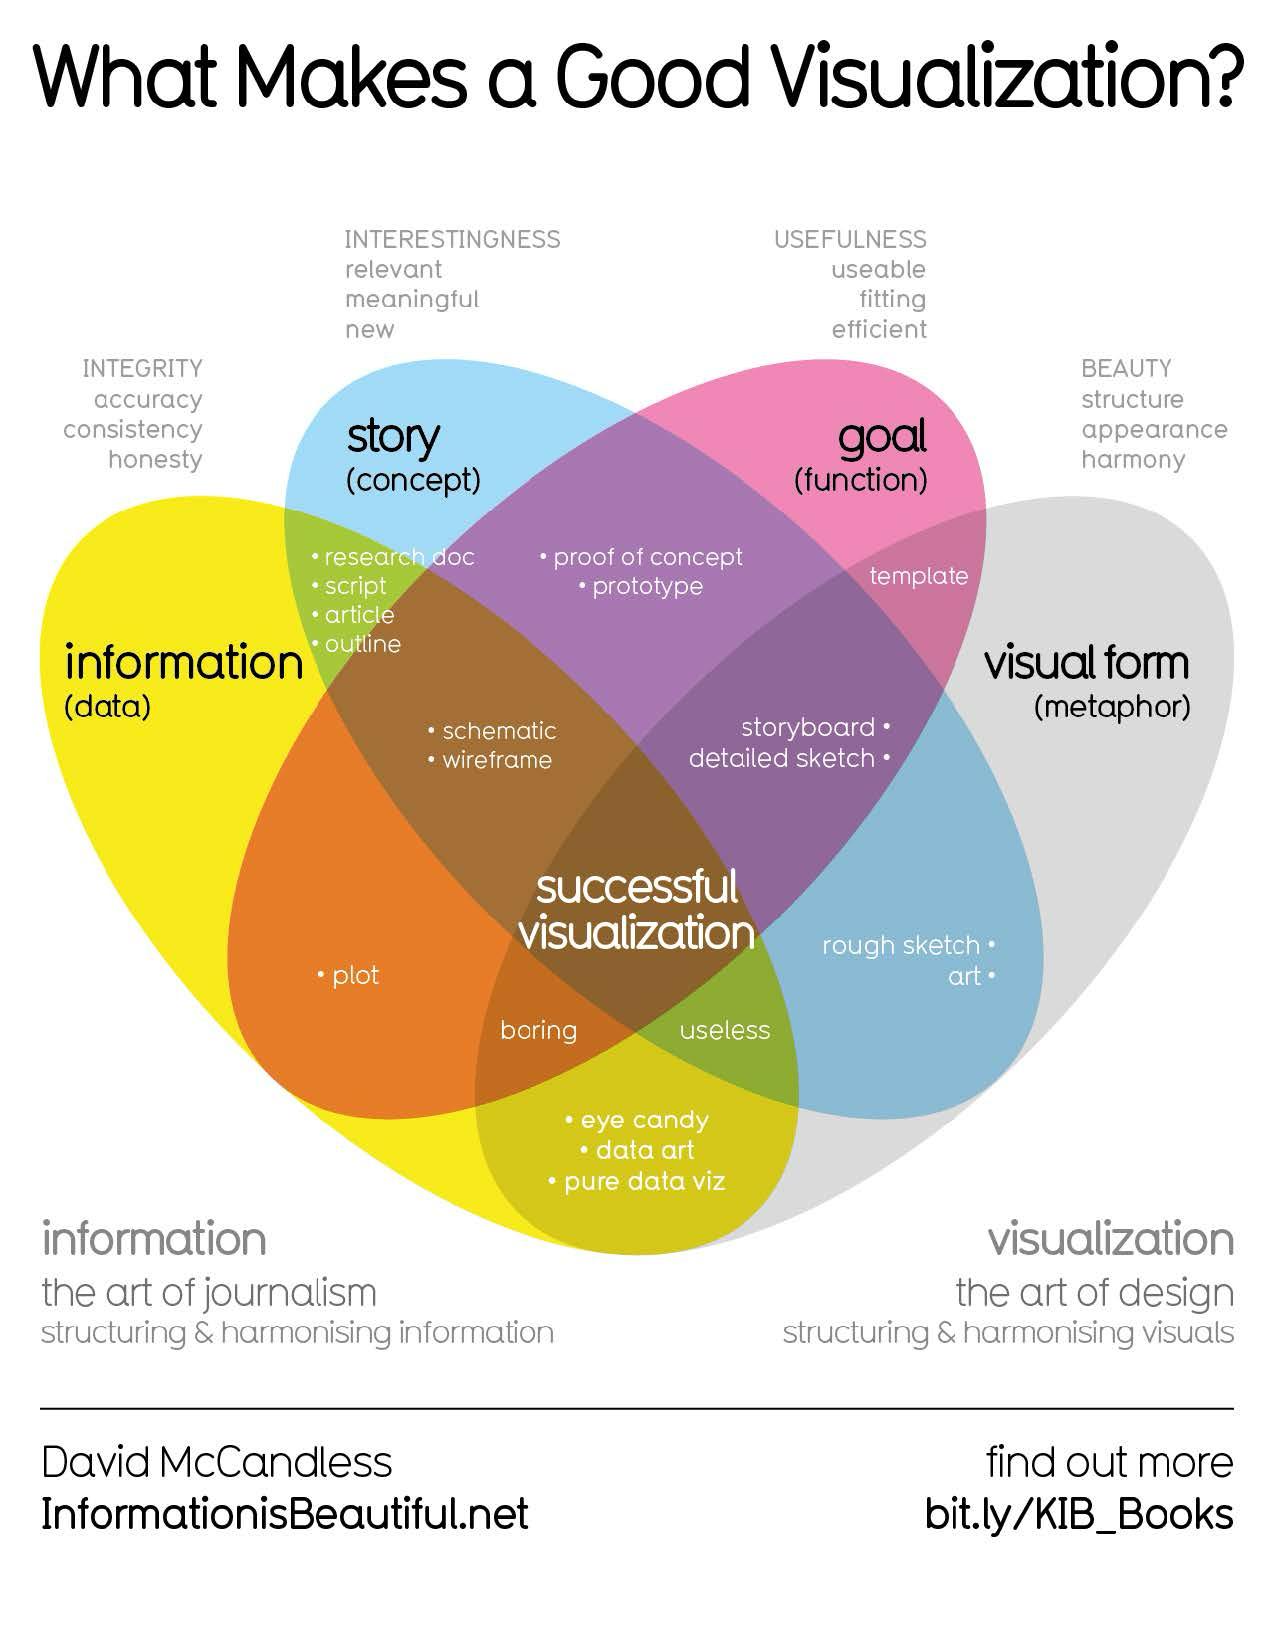
Visualising in Spite of All the Data
Paul Heinicker
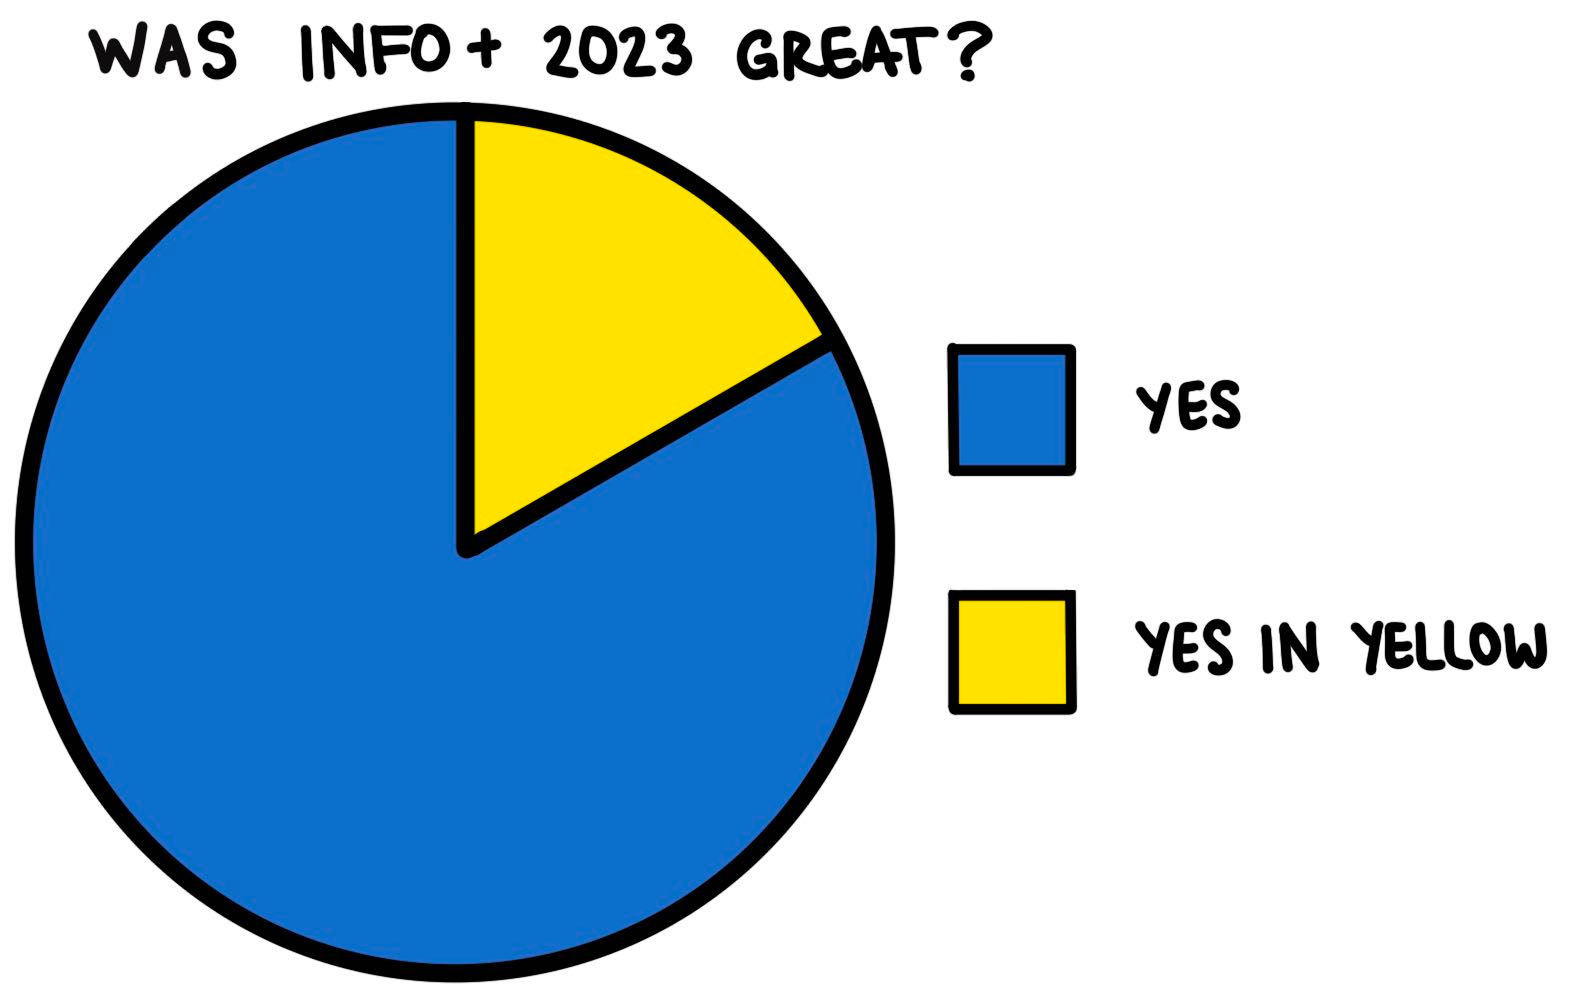
Yes, Yes in Yellow: Memes and What They Tell Us About (Queer) Use of Data Visualization
Alyxander Burns
Provenance Visualization as an Entry Point to the History and Curation of Information Collections
Tomas Vancisin, Mary Orr, Loraine Clarke, Uta Hinrichs